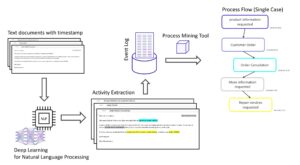
Whether with Celonis, Signavio, UiPath or another software provider, Process Mining is not just any tool, but a method of processing and analyzing data. The true core feature of Process Mining is actually a graph analysis that shows process steps as nodes (events) and edges (times). There are also other displays with a smooth transition to business intelligence, so other tool providers also offer plugins for Power BI, Tableau, Qlik Sense and other BI tools in order to visualize the results of Process Mining.
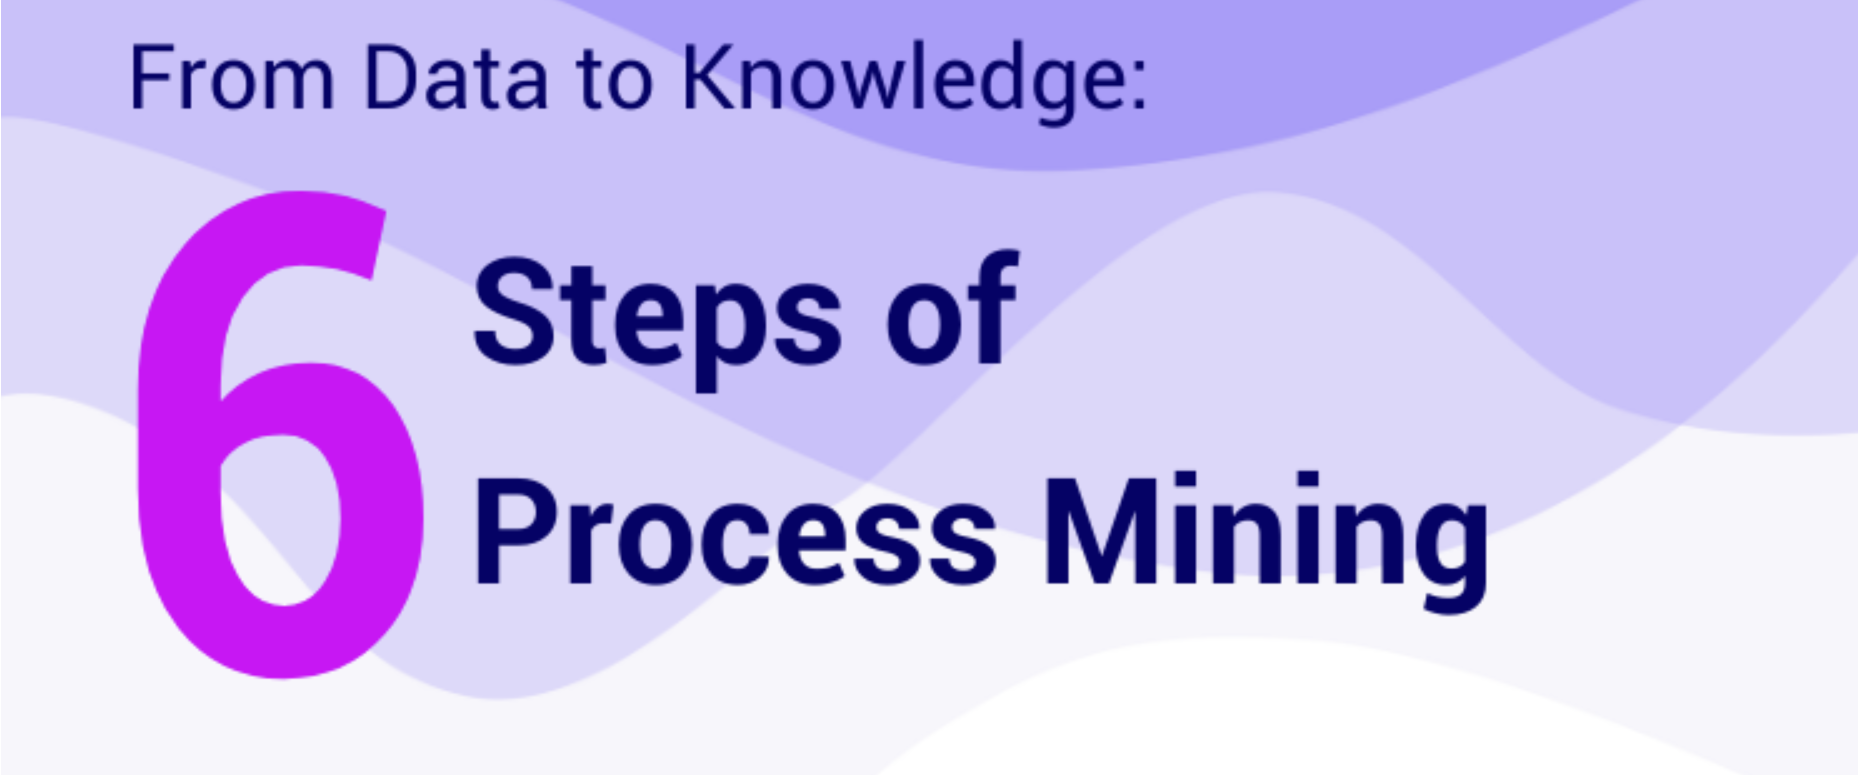
However, completely independent of the tools, there is a very general procedure in this data-driven process analysis, which we would like to describe with the following infographic:

Interested in introducing Process Mining to your organization? Do not hesitate to get in touch with us!
 DATANOMIQ is the independent consulting and service partner for business intelligence, process mining and data science. We are opening up the diverse possibilities offered by big data and artificial intelligence in all areas of the value chain. We rely on the best minds and the most comprehensive method and technology portfolio for the use of data for business optimization.


