Always keep an eye on your KPIs and ensure transparency with modern dashboards
BI - REPORTING
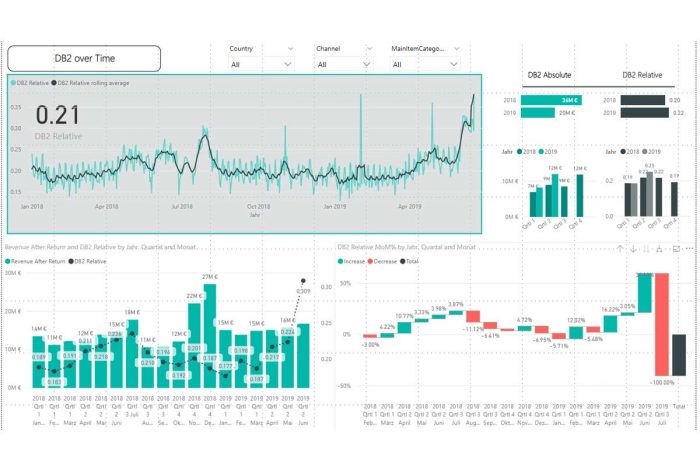
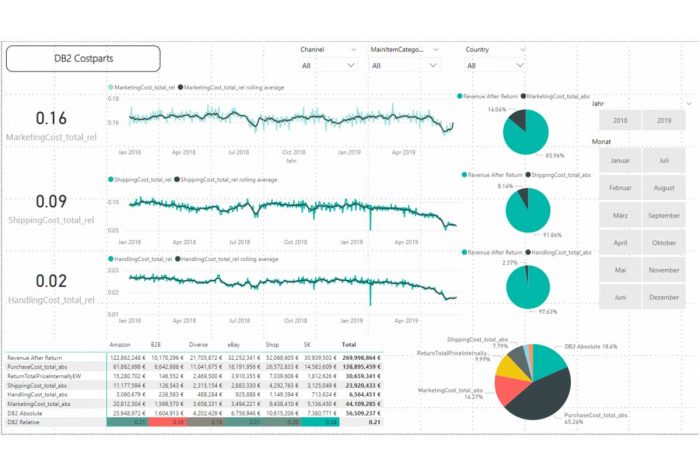
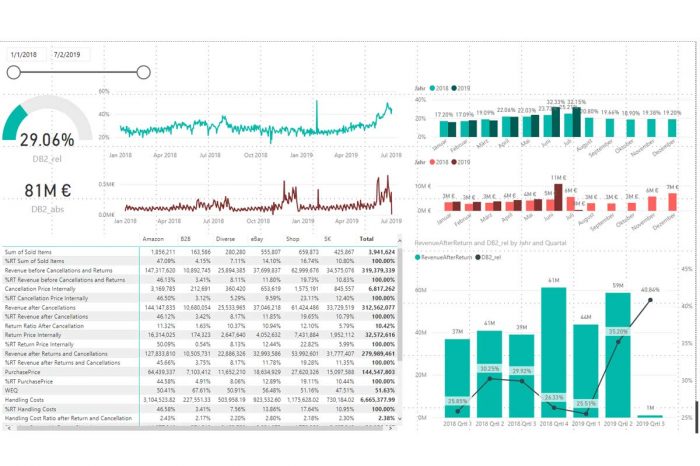
Customised Reporting and Ad-Hoc Analytics are the main applications for Business Intelligence. With our dashboards, which are individually tailored to your requirements, you can obtain up-to-date information on your business situation on a daily or hourly basis. The dashboard visualises a variety of performance indicators for your business – clearly arranged and highly condensed. Negative trends can be detected and corrected at an early stage. A hierarchical search and query (drill-down) is also possible in order to be able to carry out root cause analyses independently.
DATANOMIQ enables automated data loading processes and the establishment of reporting as a self-service for all relevant departments.
AUTOMATED DATA FUSION / ELT
Merging of separately held, but related data from relevant data sources via automated ELT process chains (Extract-Load-Transform)
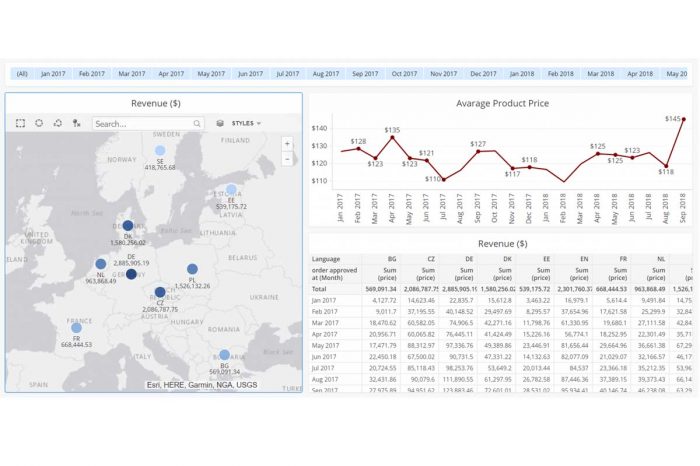
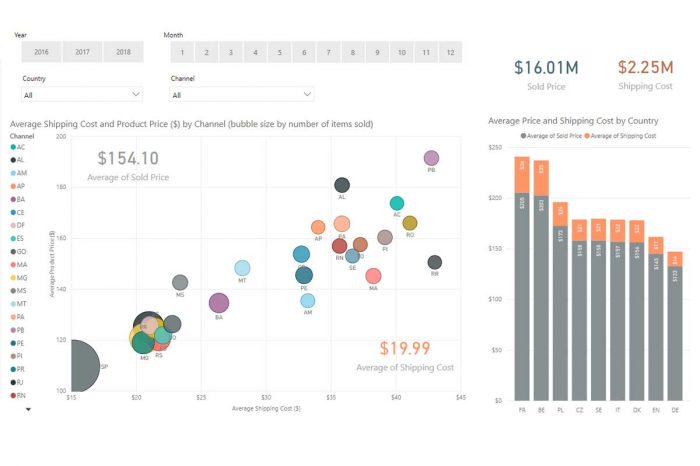
DATA VISUALIZATION
Visualization of ad hoc analyses or of daily reports in tabular or visual form
KPI ALERTING
Automatic warning levels for KPI-Monitoring
FORECASTS
Integration and visualisation of forecasts, for example about sales, demands or warranty cases
STANDARD REPORTING
Standard reporting is automatically loaded and processed weekly, daily or hourly